Date: 2023-12-13
The Summary
I've been using Grafana to monitor my home-lab. It's an interesting
setup. I came over from Munin which was great,
but is meant for a smaller lab. Munin has a five minute
timeout issue which caused problems on my Raspberry Pis.
I like Grafana. Its interface is a bit JS-heavy, but that's the unfortunate
price we pay for modern web tools. It can get laggy at times, and some parts
of the interface are fairly unintuitive to me, but overall it's a nice system.
I think my biggest complaint is the separation of the front-end and back-end.
I would have liked an all-in-one setup, but VictoriaMetrics isn't too bad. I can use
the VMAgent to gather a solid set of data, and Grafana pulls
from the VictoriaMetrics instance nicely.
The Setup
I've got the instances running as containers in my Kubernetes
setup which is nice as I can throw them away and rebuild them quite easily.
The downside is that I can't save interface changes, those have to be added to
a config-file to make them permanent. That's not too difficult tho, as Grafana
outputs everything to a json file, which makes for easy management. I just
wish I could get it to output to a raw json file, rather than their JS monstrosity.
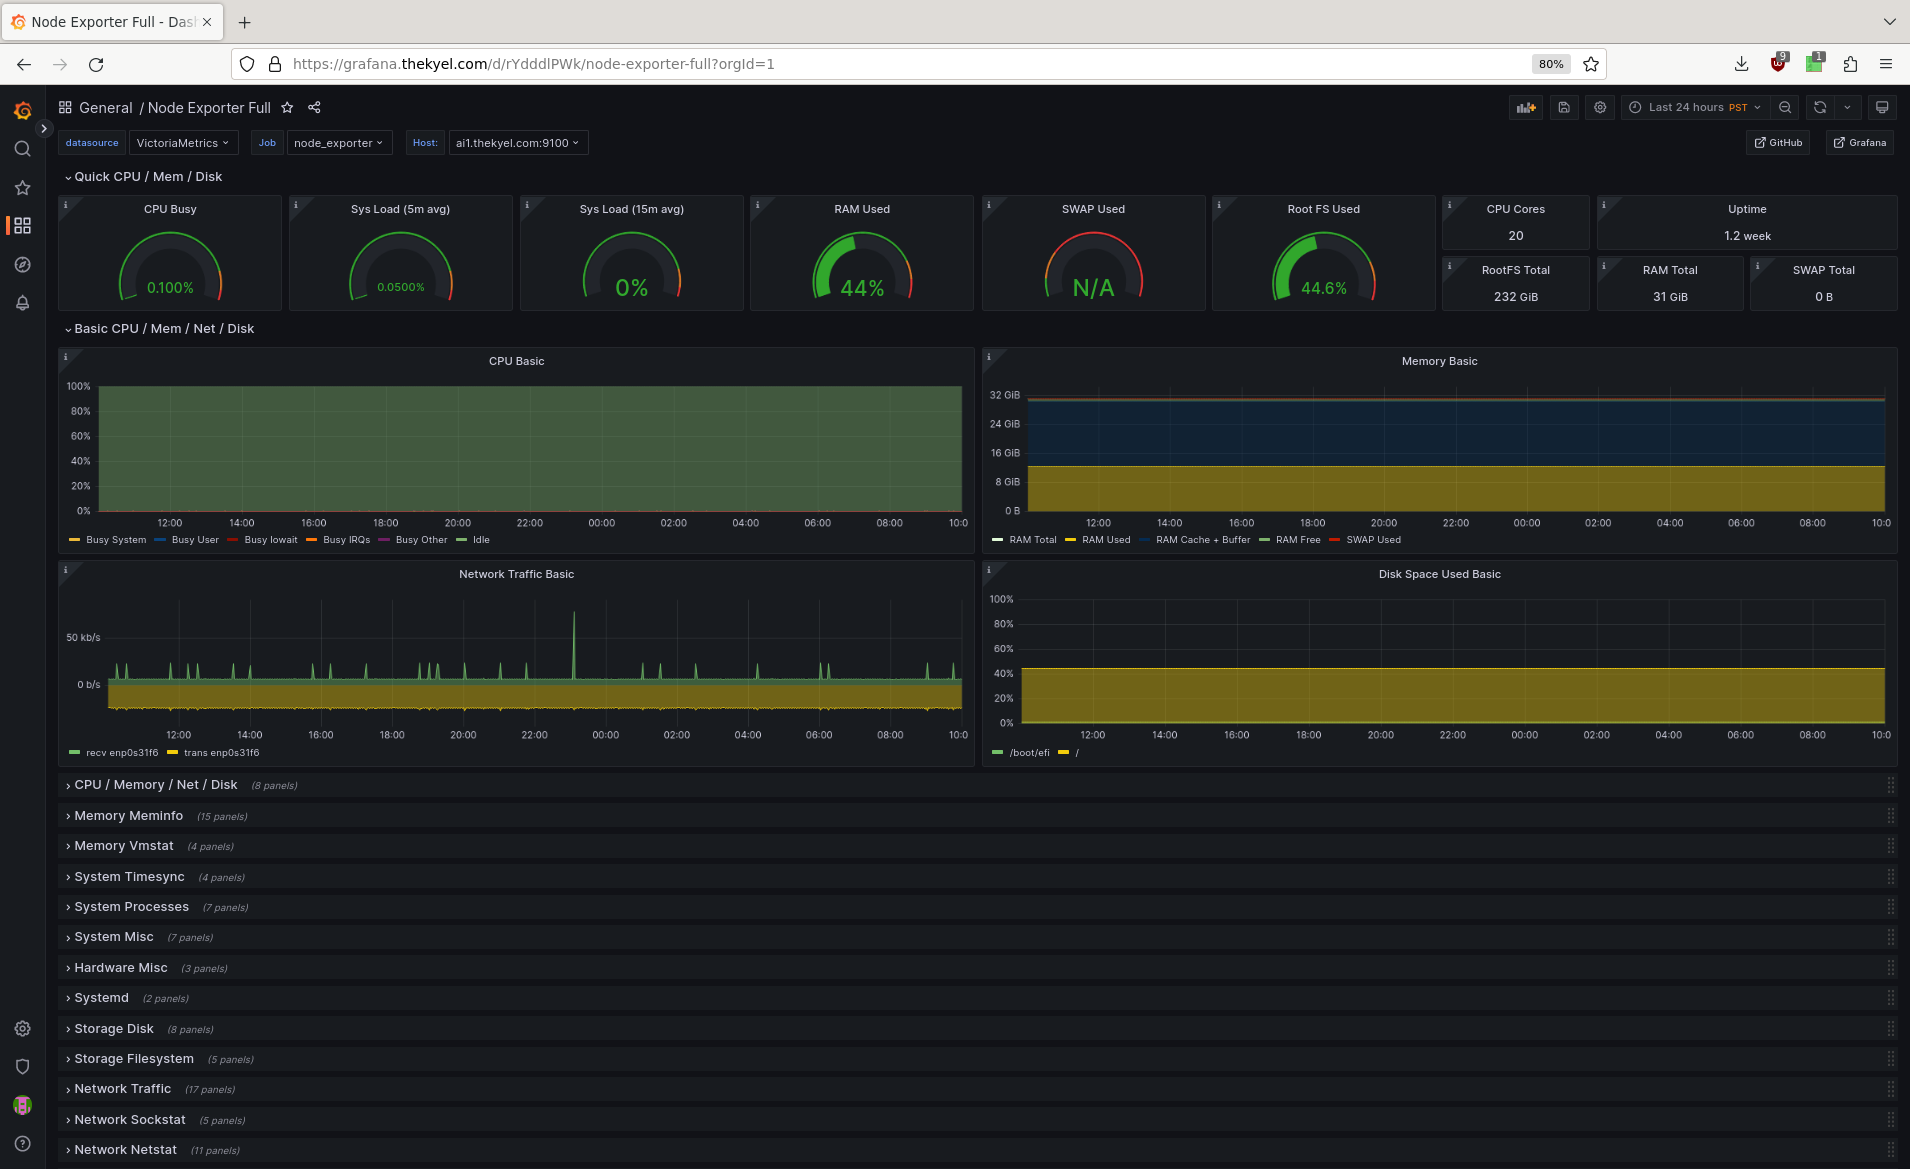
The VMAgent gathers the data, and Grafana comes with Node-Exporter which
works well as a default. It gives me a good set of metrics out of the box, and
allows me to drill down deeper if I need to:

And adding custom metrics isn't too hard. I need to get around to adding
metrics for my AI GPU, but that's a different post altogether |;)
